Land
The Definitive Measure on the Urban Myth of the Urban Exodus
There is no disputing cities, especially big cities, suffered increases in out-migration, but was it an "exodus?"

We've all heard the reasons to believe in the Great Urban Exodus of 2020. People escaping the coronavirus. Telework letting people go anywhere, and so they did. The civil unrest after the death of George Floyd sparked a flight to safety. And the images of long lines waiting to bid above asking price for a suburban bungalow made it easy to believe.
But the data now shows that what we saw and what we believed are only half the story, and without the other half, we don't know the story at all.
Stephan D. Whitaker, a policy economist for the Federal Reserve Bank of Cleveland, has published the most thorough, convincing and illuminating data set and analysis of urban migration in the Year of COVID that we've seen.
For background, Whitaker uses data largely from the Federal Reserve Bank of New York/Equifax Consumer Credit Panel, "a nationally representative anonymous random sample of 5 percent of US consumers with a credit file, resulting in a sample of more than 10 million adults." He compares the monthly urban migration numbers to the average for the corresponding months for each of the prior three years.
Two observations on what this means for housing demand, both in dense urban cores and in the outer suburban rings.
- Framing bias focus on out-migration from downtown urban areas could produce dramatic miscalculations of demand. Once companies begin recalling employee associates to offices in the coming months, look out for an entire cohort of rookie recruits being called in, and for many others, who'll return from hunkered-down, out-of-town refuges to where the action is.
- Secondly, urban core out-migration may have picked up velocity because of coronavirus and social upheaval, but it was a trend prior to those forces, and may simply have pulled forward that number of out-migrating households, rather than impacting the longer-term statistical change.

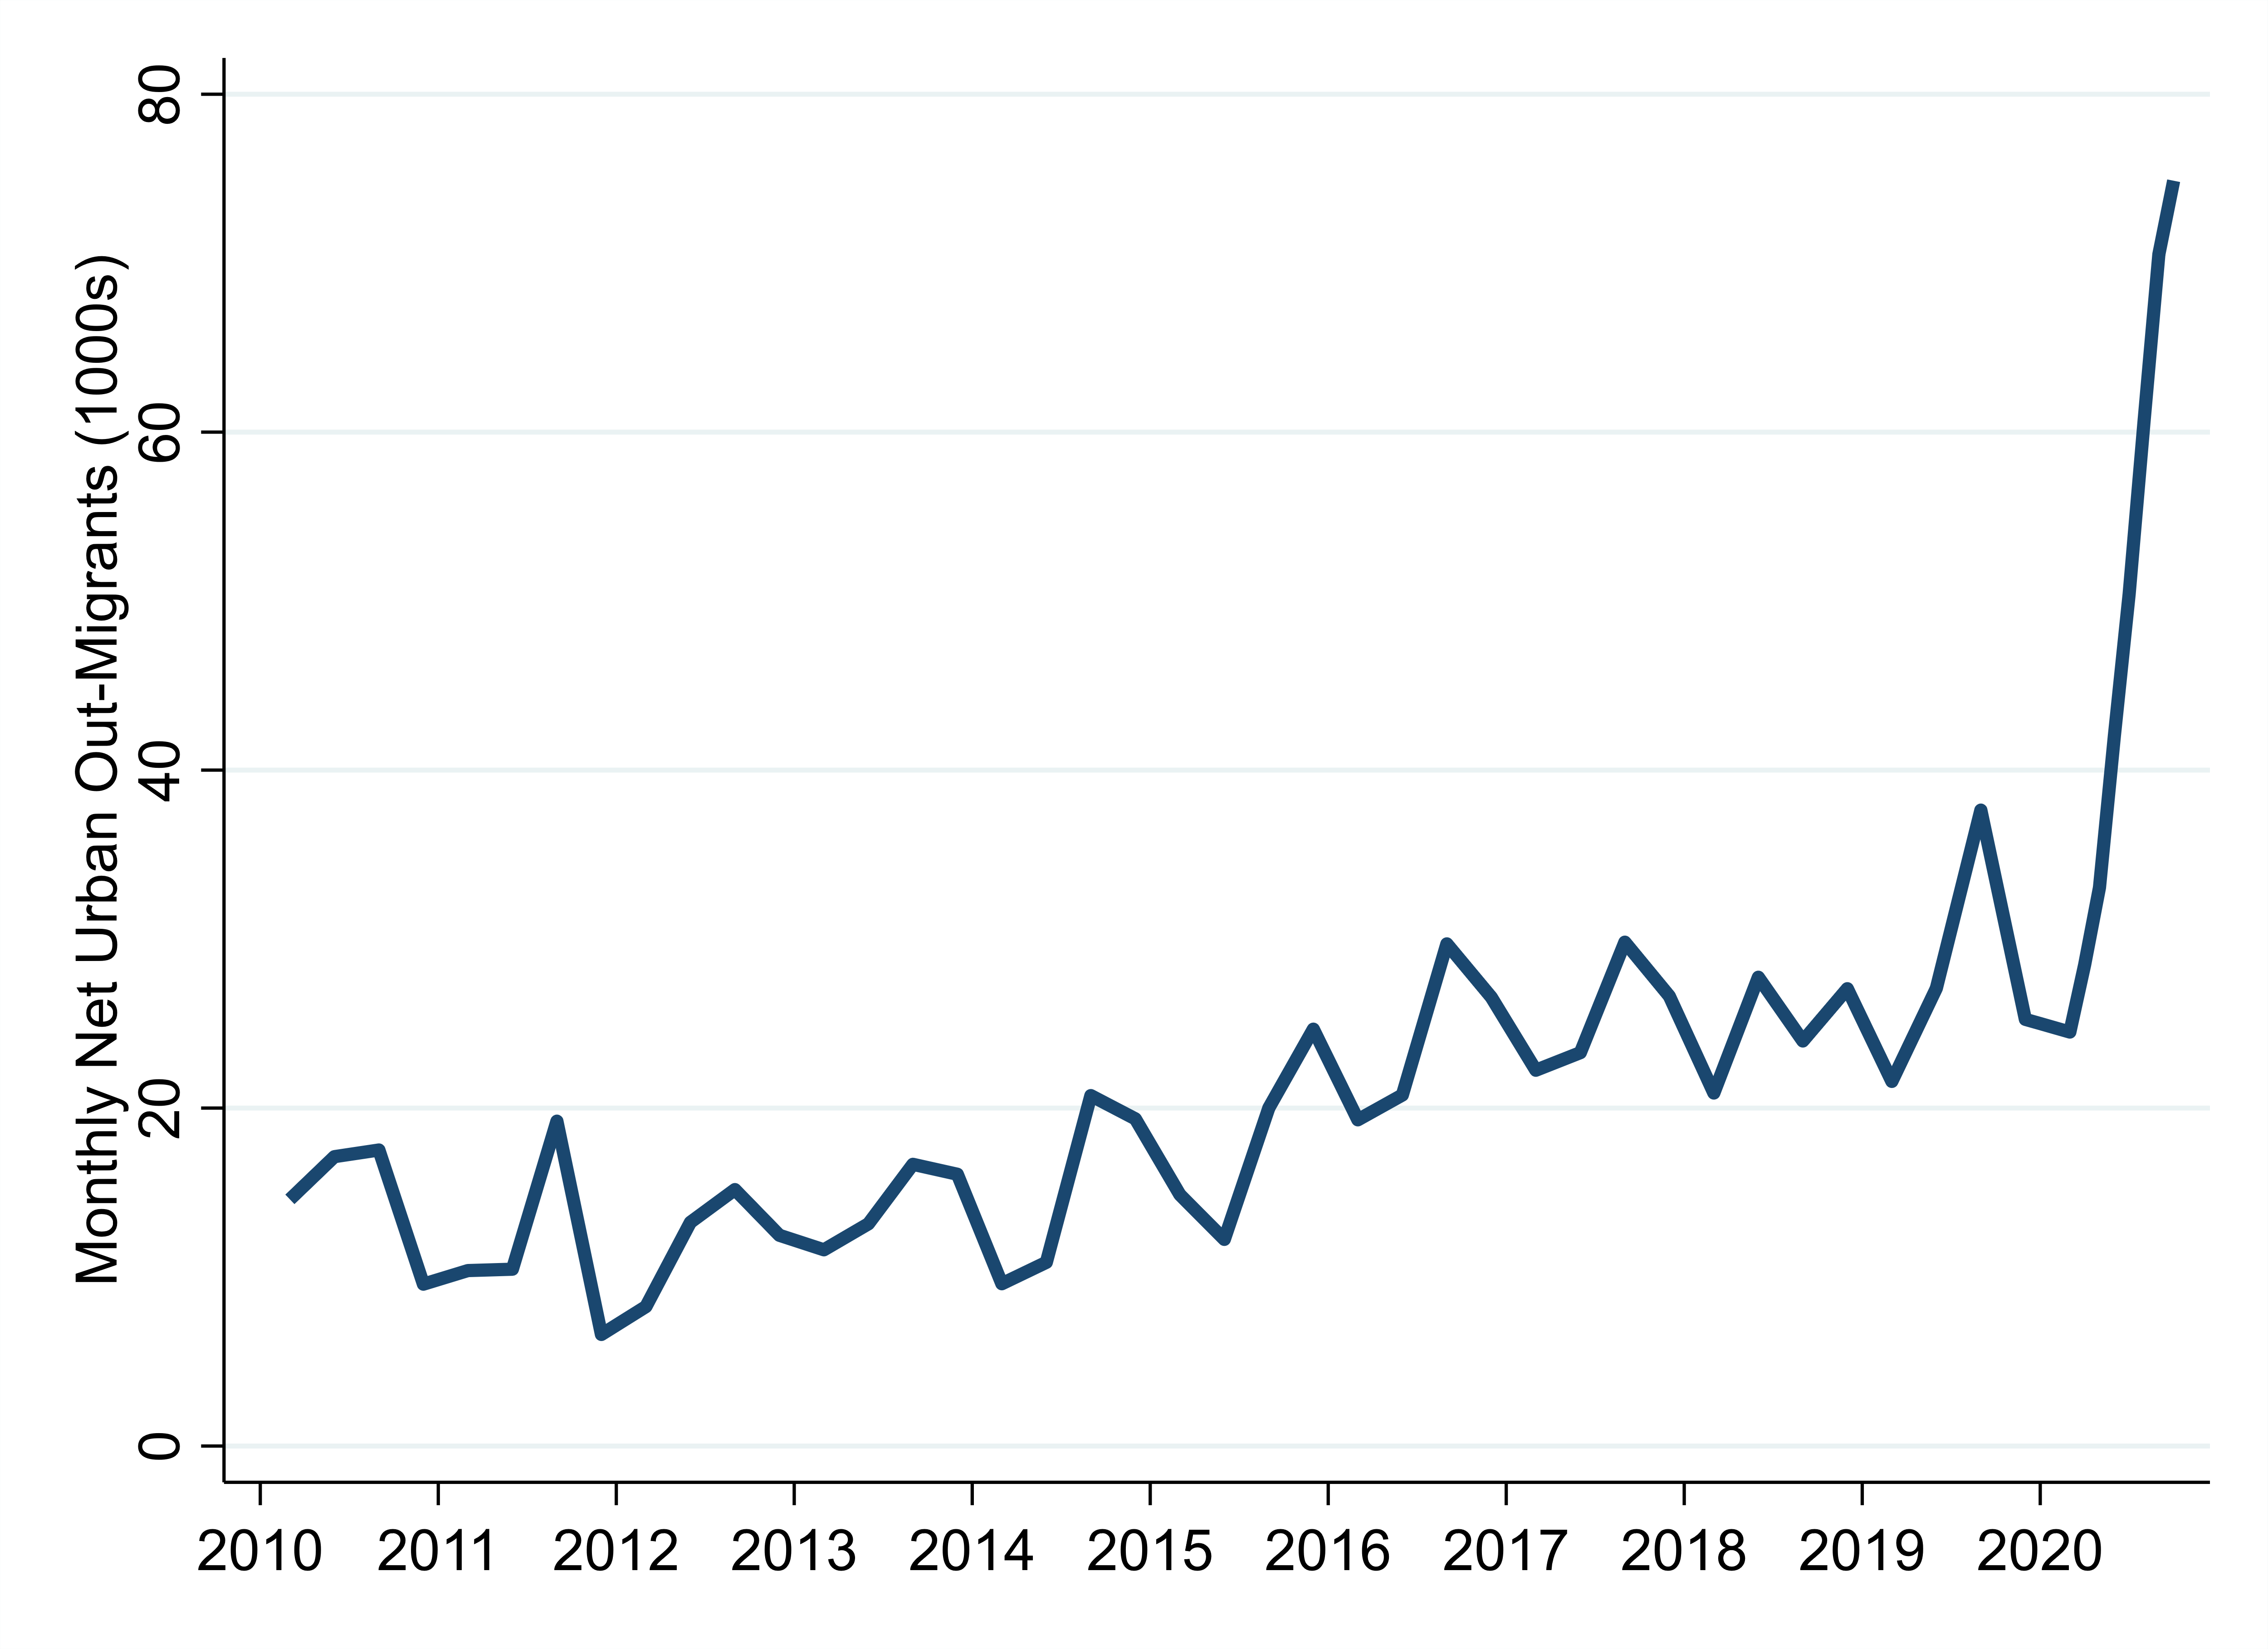
This is the chart that visually confirms our prior beliefs about what we thought we knew: migration out of cities in 2020 was nearly twice as great as the year before. But we are talking here about net migration, which means there were nearly 80,000 fewer people living in urban areas a month by the fourth quarter of 2020, but not all of them left. Many of them just never came.

And this chart shows us what was different about 2020. The grey line of urban in-migrants – that is, people moving into a city in that year – traditionally tracks with the urban out-migration. Except last year, when the number moving into cities took a dive. In fact, Whitaker notes, "the declines of in-migration are almost always greater than the increases in out-migration."
To emphasize that point, here are the top 10 metro areas with the greatest net out-migration in 2020. The numbers are the migrants per 100,000 metro area residents. Only in the southeast Connecticut, San Francisco and New York City metro areas was the negative change in inflow not greater than the outflow.

When we look at the demographics behind the net decline of the urban metro areas, some concerning developments arise. First, the net out-migration of people below the median income surpassed the people above median income for the first time since at least 2017, even though those above median income, themselves, almost doubled in net out-migration from 2019. Perhaps related, net out-migration of renters was dramatic, easily surpassing home owners for the first time, and persons 18-34 became net out-migrants in earnest. Overall, the impact was greater the larger the city, although there are notable exceptions with some cities not recording a negative migration at all.

In the charts above, the red line indicates the beginning of the George Floyd protests. While the protests varied by city in violence and duration, Whitaker found that in these six cities with extensive protests, "the most recent net out-migration estimates are more than twice as high as the average during the preceding three years."
The question remains how much of this disrupted migration pattern will hold up after some state of normalcy returns. The biggest factor may be how social unrest plays out, but the re-opening of businesses and the attainment of herd immunity should remove two of the greatest impetus for urban abandonment. In any event, the work of Stephan D. Whitaker should help us all recalibrate our considerations.
Join the conversation
MORE IN Land
Steel, Skeptics, And The Real Innovators In U.S. Homebuilding
TBD MasterClass contributor Scott Finfer shares a brutally honest tale of land, failed dreams, and a new bet on steel-frame homes in Texas. It's not just bold — it might actually work.
Home At The Office: Conversion Mojo Rises In Secondary Metros
Big cities dominate an emerging real estate trend: converting office buildings into much-needed residential space. Grand Rapids, MI, offers an economical and urban planning model that smaller cities can adopt.
Rachel Bardis: Building A New Blueprint For Community Living
A family legacy in homebuilding gave Rachel Bardis a foundation. Now, as COO of Somers West, she’s applying risk strategy, development grit, and a deep sense of purpose to Braden—an ambitious new master-planned community near Sacramento.