Capital
iBuyers Defy Doubters As They Retrace Toward Former Levels
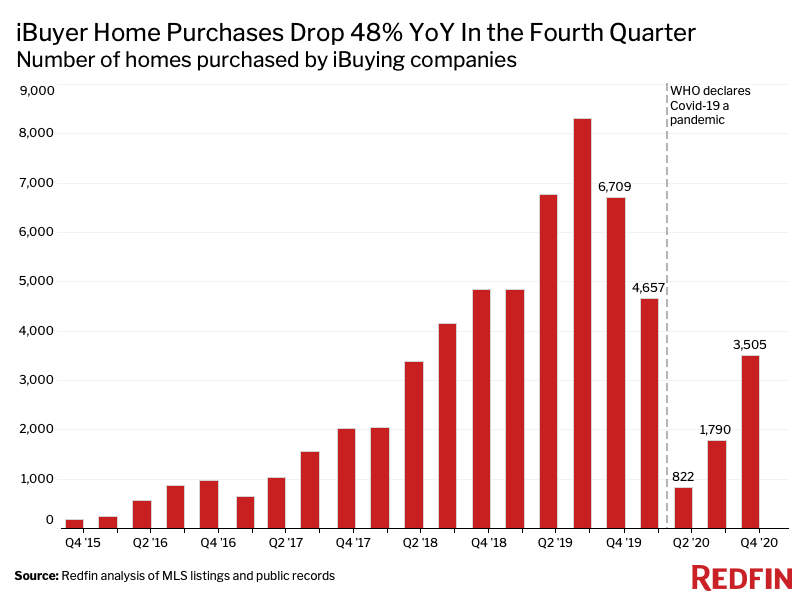
iBuyers, the vaunted proptech buyer-seller matching platforms that had barely established a footing in home sales pre-pandemic, are clawing back as a percentage of residential transactions.
Rumors of the demise of iBuyers' starring role in the future of residential property transactions have been exaggerated. Rather, the vaunted, heavily-invested, Big Data-meets-reduced-friction-real-estate proptech channel appears to have taken a page from a biologically proven survival tactic, spotlighted here.

- iBuyer transactions accounted for 0.3% of home sales in Q4 2020. The bad news is that's a big dive from the 0.8% share of the market iBuyers represented the same period in 2019.
- The good news is that 0.3% reflects an upward trajectory, and a steeper growth rate from the 0.2% iBuyer share figure in Q3 2020. That's a retrace upwards.
- Locally, Phoenix, Raleigh, and Charlotte, are relative outliers in iBuyer transaction volume as a percentage of total home sales.
- Here's one data measure that speaks to why sellers go the iBuyer route:
In a majority of the top 27 iBuying markets, iBuyers sold their inventory faster than the typical homeowner, with the largest margins in Austin, TX (29 days faster), Riverside, CA (28 days faster) and Raleigh (27 days faster). Minneapolis, Tampa, FL and San Diego were the only metros where iBuyers took longer to sell homes.
Redfin, a national network of real estate brokers, has skin in the iBuyer game with a platform called RedfinNow, and it also scrapes MLS listings and public records for iBuyer transaction volume on a quarterly basis. Redfin determines iBuyer market share by dividing homes sold across all of the markets that Redfin covers by all known home purchases made by RedfinNow, Opendoor, Offerpad, Zillow Offers and Bungalo.


