Marketing & Sales
Apples And Oranges: Why Housing Bubbles Don't Compare
Contrasts between the 2006 house price boom and today's run-up? For sure. Still, some are jittery over one similarity, the gap between median household wages and median prices.
Not all bubbles are equal.
CoreLogic principal and economist Molly Boesel unpacks our recent historical house price run-up in light of comparisons – and important sharp contrasts – with the housing bubble of the ought decade.
As it happens, April 2021 commemorated the 15th anniversary of the peak of the last housing contagion that led to the financial crisis that led to the Great Recession.
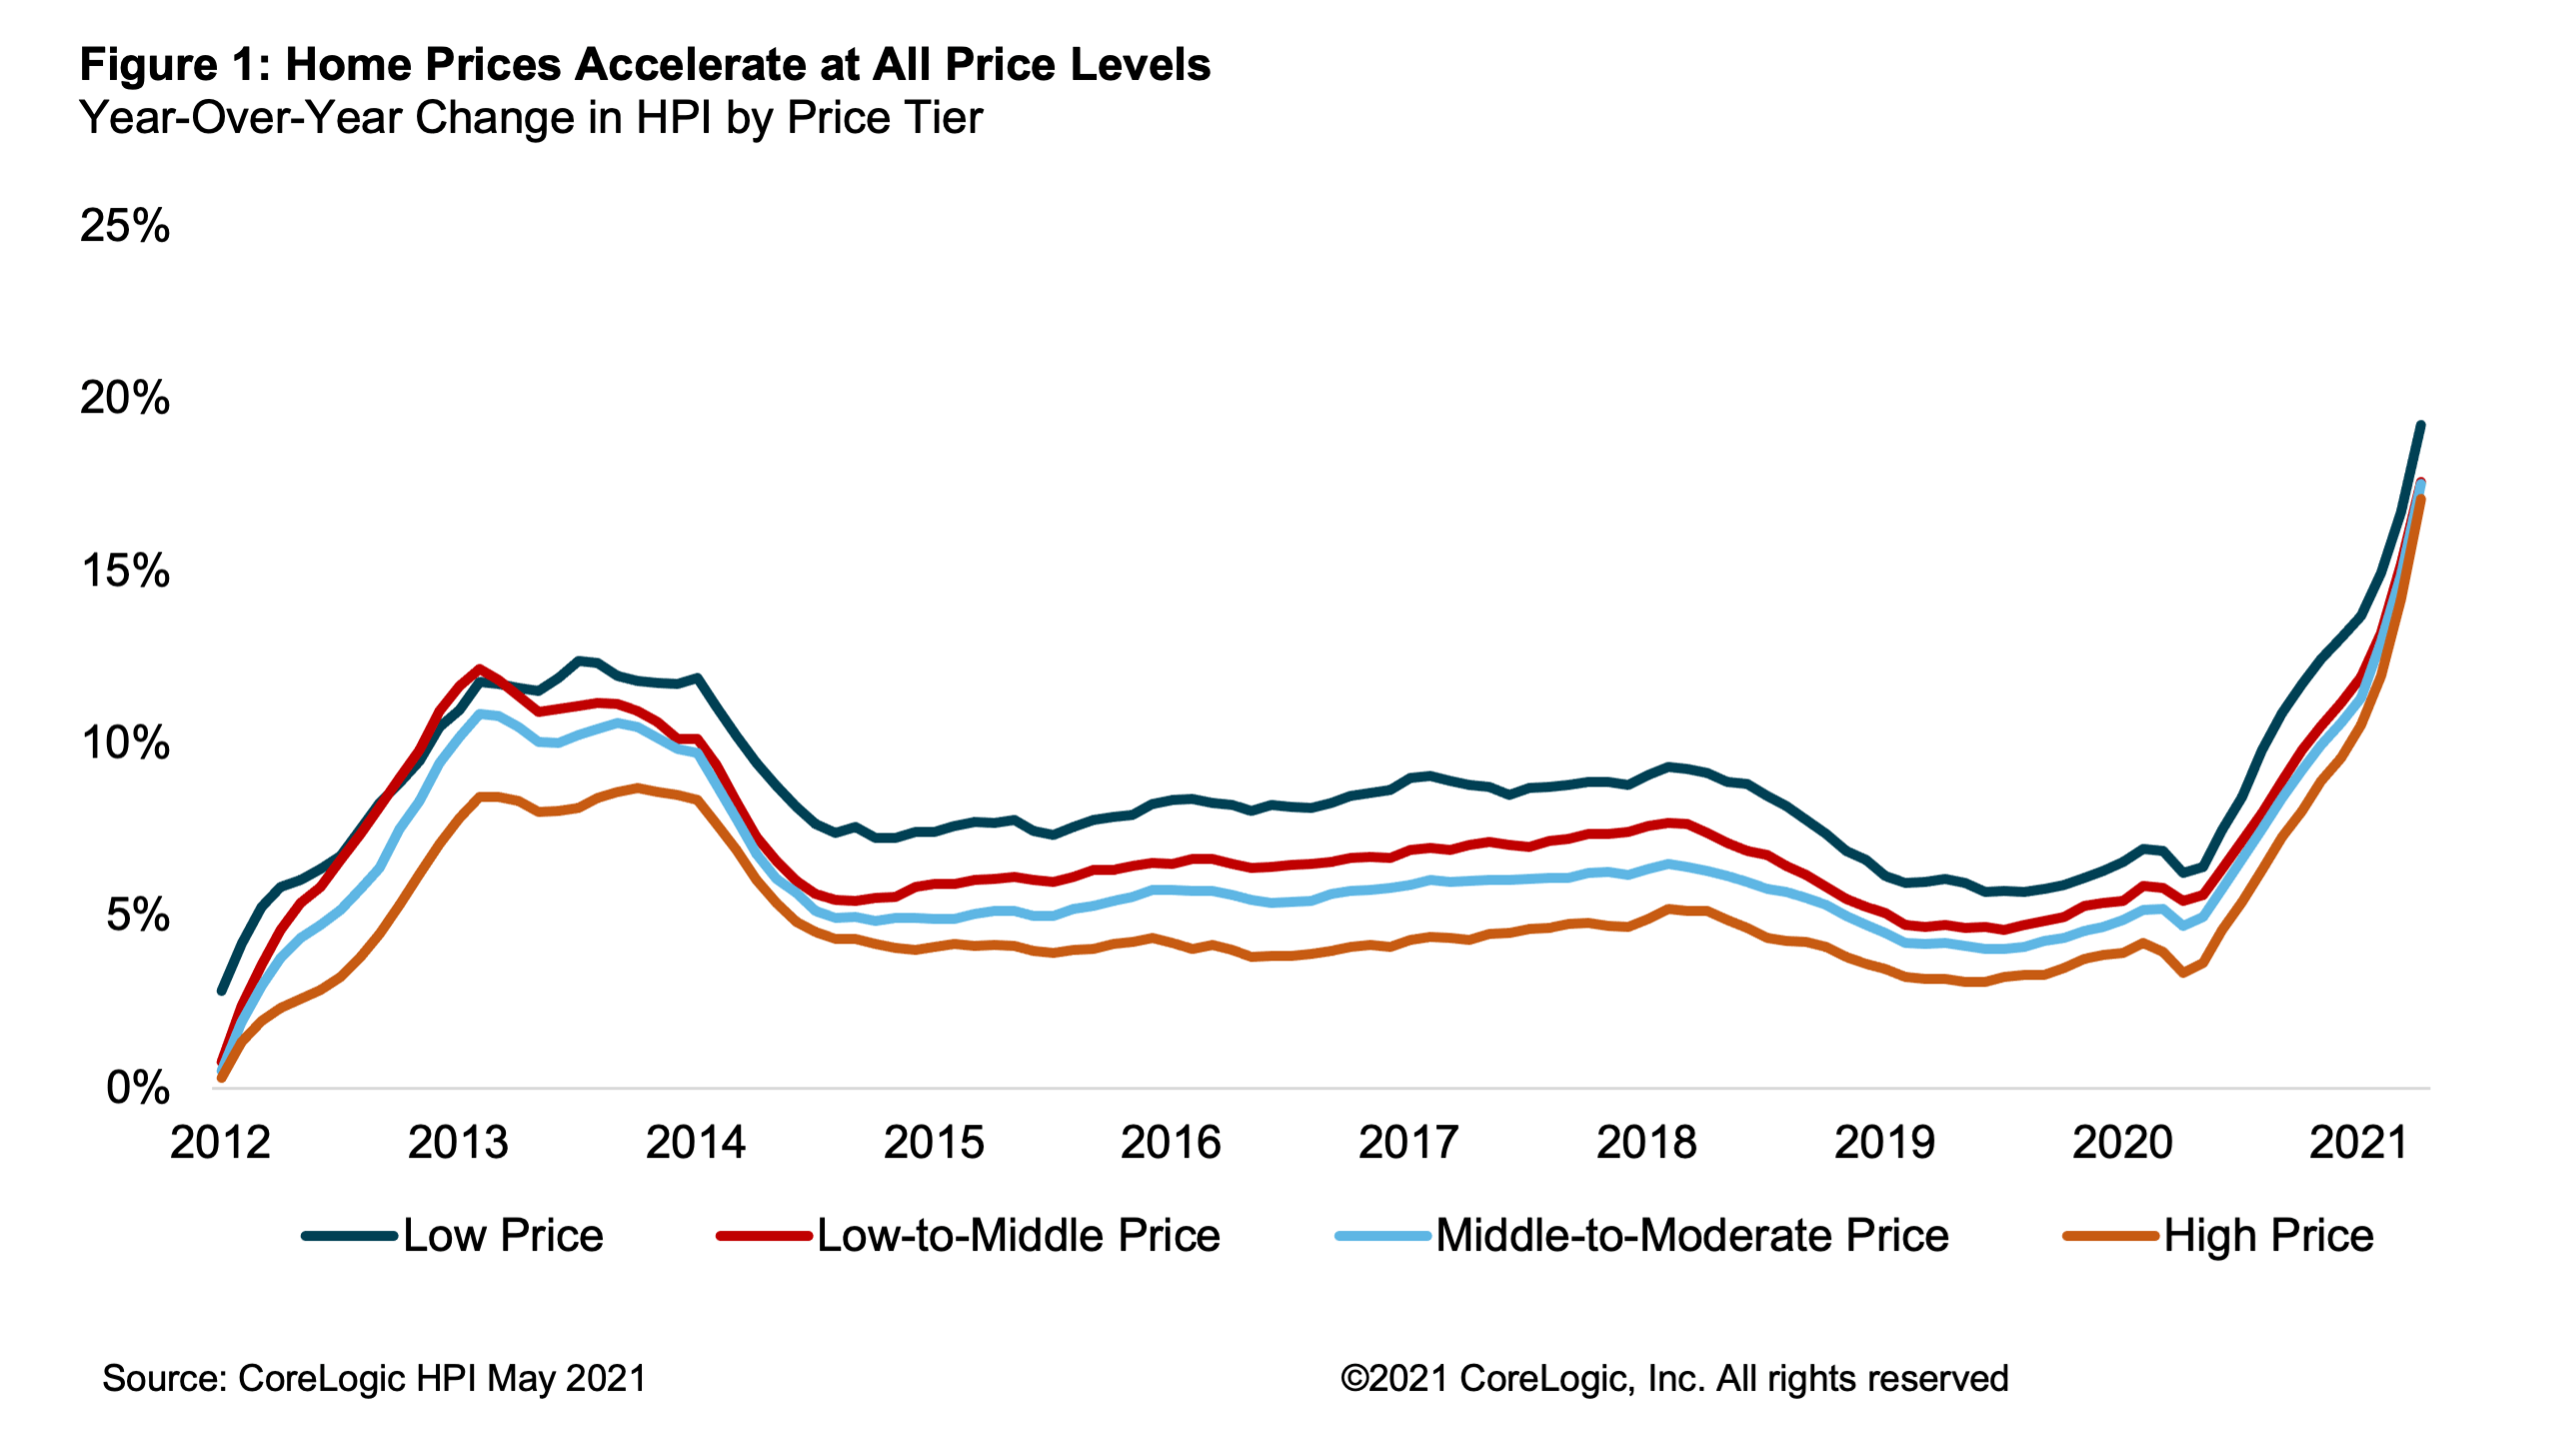
Reflexively, some can't help but feel twitchy as home prices unspool upward – up by 15.4% in May, and recording a year-on-year gain that surged the most since 2005.
Economists tend to accentuate the differences between the two periods, citing lower household debt, tougher mortgage criteria, a sustained period of less prolific building, lower property vacancy rates, etc.
Further, goes the narrative, we're too smart now – and Uncle Sam is too accommodative – to let that kind of deflationary death spiral take hold again.
Boesel's point of contrast between 2006 and 2021 is simpler. She draws the difference between the two price run-ups first by duration. She notes that house prices enjoyed 14 consecutive years of increase by 2006 – a double-cycle worth of home appreciation – whereas the current upturn, coming out of The Great Recession, is now at 10 years.
Headroom?
Boesel allows for some comparison between the two surge cycles. Specifically, she notes that the ratio of median house price to median income match up similarly from the earlier boom to this one. In both cases, median house prices clock in at about three times median household income.
What makes putting one boom next to the other an apples to oranges comparison, Boesel asserts, is the difference in mortgage rates.
In 2006, she notes 30-year fixed mortgage interest rates were running at about 6.5%, which elevated average monthly payments for a buyer to about $1,275.
In stark contrast, today's average 30-year fixed rate of half the level in 2006 mean that payment-to-income ratios improve mightily. Instead of $1,275 monthly payments – 25% of household income in 2006 -- buyers today spend just 17% of their household wages on the payments, or $975.
Boesel notes:
Lower payment ratios significantly limit the risk of home price declines over the next 12 months. According to the CoreLogic Market Risk Indicators, 13% of metro areas were at risk for home price decrease in 2006, but that risk fell to near zero in 2021.
Home prices increased quickly so far in 2021, fueled by low inventory and low mortgage rates. As prices grow out of reach for some and inventory loosens, home price gains are expected to slow over the next year. However, rising interest rates will hurt affordability, with the typical mortgage payment projected to rise 6% to near $1,000 by April 2022.
Crossing that $1,000 monthly payment line is a big deal, especially for a new-home residential and construction juggernaut that spent the better part of the past five years pivoting its mix shift to greater exposure to product pricing within FDA, Fannie, and Freddie caps, specifically to win more first-time buyers over from renting, from their parents' basements, etc.
The role – and political charge -- of irresistibly low interest rates comes clear in Boesel's analysis on both the income to monthly payment ratios and the monthly payment level she points to as source of one of the big differences between then – 2006 – and now.